Inside vs outside: a month of minute-by-minute air readings from Delhi NCR homes
aqi0 monitors in homes across Delhi, Gurugram and Noida report PM2.5 once a minute. We lined up a month of those readings against the official monitoring station nearest each home. The pattern is the same everywhere: the city's air is worst at night, and that is exactly when these homes are cleanest.
Where we measure
Each green dot is a home with an aqi0 whole-home air purifier (technically a positive-pressure fresh air system) and at least one aqi0 monitor inside. Each blue square is a government monitoring station (CPCB, DPCC, HSPCB, UPPCB) or a neighbourhood sensor on the open AirGradient network. The number is the median PM2.5 for the window you pick.
Delhi · Gurugram · Noida, median PM2.5
The 24-hour shape
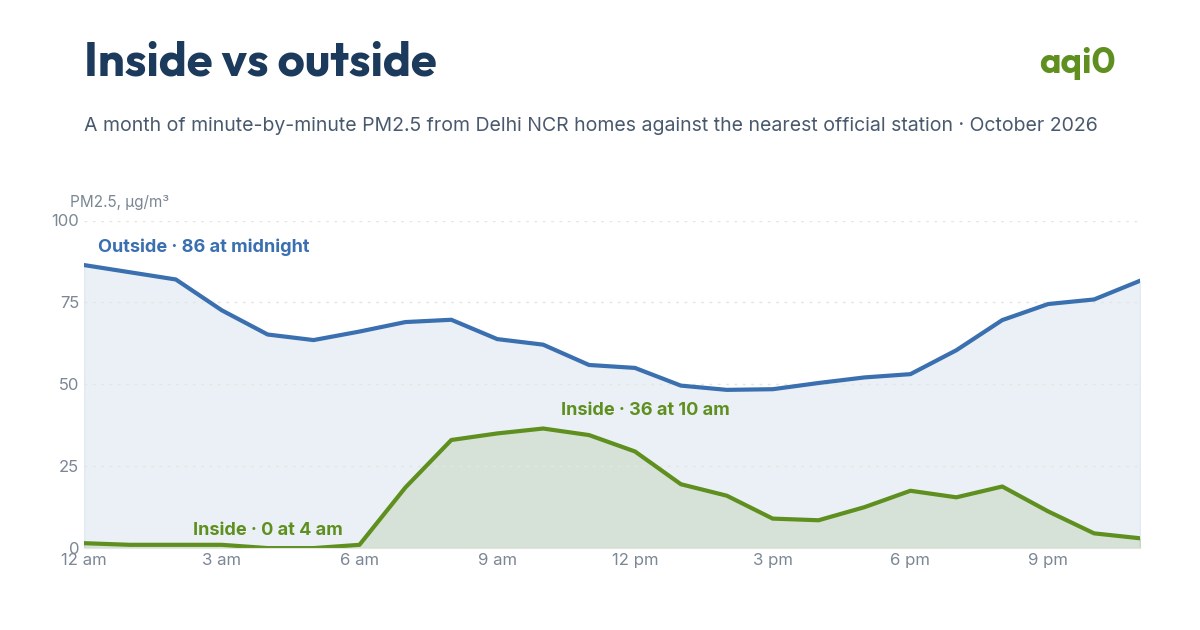
Outdoors, the night is the dirty part of the day. Cooler air traps the day's smoke and dust near the ground, so the stations climb from early evening and peak around midnight. Indoors the curve runs the other way. With doors closed and everyone asleep, the system has the house to itself and pulls the air down to near zero by 2 am.
The morning is where the two curves come closest. Between 7 and 11 am doors open for school runs, help arrives, breakfast cooks, and the house catches up to a fraction of what the street is carrying. By early afternoon it has pulled back again.
Median PM2.5 by hour of day, 8–18 October
Not an average. Every home we are tracking.
Fleet medians hide the spread, so here is each home on its own, with the outdoor station nearest to it. Overnight is midnight to 6 am, day is 10 am to 6 pm, evening is 6 pm to midnight. Where a home has two monitors their readings are pooled. Outside numbers are the same station over the same dates as that home's readings. “Hours at zero” is how many hours a day the home spends at 2 µg/m³ or below.
Day by day, as October turned
The outside line is the median across the stations. From 19 October the official feed we read through OpenAQ ran late, so the last four days rest on the four neighbourhood sensors alone and are drawn dashed. Even with that caveat the direction is clear: the city stepped up through the third week of October while the homes stayed flat.
Daily median PM2.5, 1–22 October
What separates a 0 from a 9
Same system, same filters, same city, and the overnight numbers still split into two groups. Three homes in four reach effectively zero every night and get there within an hour or two of the family turning in. The rest hover between 4 and 9 all night and never quite reach zero.
The difference is the building. A positive-pressure system works by pushing filtered air out through the gaps in the envelope so nothing comes in. When the gaps are small (good windows and doors that close properly, sealed AC pipe sleeves, no open ducts) the pressure builds and the home reaches zero. When the gaps are large, the system is still diluting the room all night but never gets ahead of what is leaking in. Sealed homes perform much better, and sealing is the cheapest upgrade we know: it is why every aqi0 proposal now carries a sealing note.
Overnight PM2.5 by home, lowest to highest
More from the same month
Indoors by hour, weekday vs weekend, 8–18 October
What we take from it
A home can be at PM2.5 zero at 3 am while the station two streets away reads 90. The air outside is not a ceiling on the air inside.
Three things stand out. First, overnight is the strongest result in the data, and overnight is when people spend eight uninterrupted hours in one place. Second, the morning bump is real, and it is mostly about doors and cooking rather than the system. Keeping the kitchen door shut while the chimney runs, and not propping the front door open, is worth more than any filter upgrade. Third, the homes that sit higher in the table are the leakier ones: a balcony door that does not latch, a window that was never meant to seal, an unsealed AC sleeve. The same system in a tighter home reads zero.
Less is better. Period. A home that holds under 15 µg/m³ through the day and under 5 overnight is doing something the city around it cannot do yet, and the numbers above are how we check that it keeps doing it.
How the numbers were made
- Indoor. aqi0 monitors (laser particle sensor, one reading a minute) report to our own servers. Only readings the device marked valid are used. Each number on this page is a median; the morning and evening bands are IST.
- Outdoor. Hourly PM2.5 from 24 government stations (CPCB, DPCC, HSPCB, UPPCB) read through the OpenAQ archive, plus four open AirGradient neighbourhood sensors, 22 September to 22 October. Each home is paired with the station nearest to it by straight-line distance, shown in the table.
- Left out. Monitors with under five days of readings, one home outside NCR, and a handful of monitors where the system was not running for the period. Nothing else was filtered.
- Not shown. Household names, flat numbers, monitor IDs, and anything that identifies a family. Society or locality names only.